Education in Afghanistan
/ 9 min read
1. Completion rate
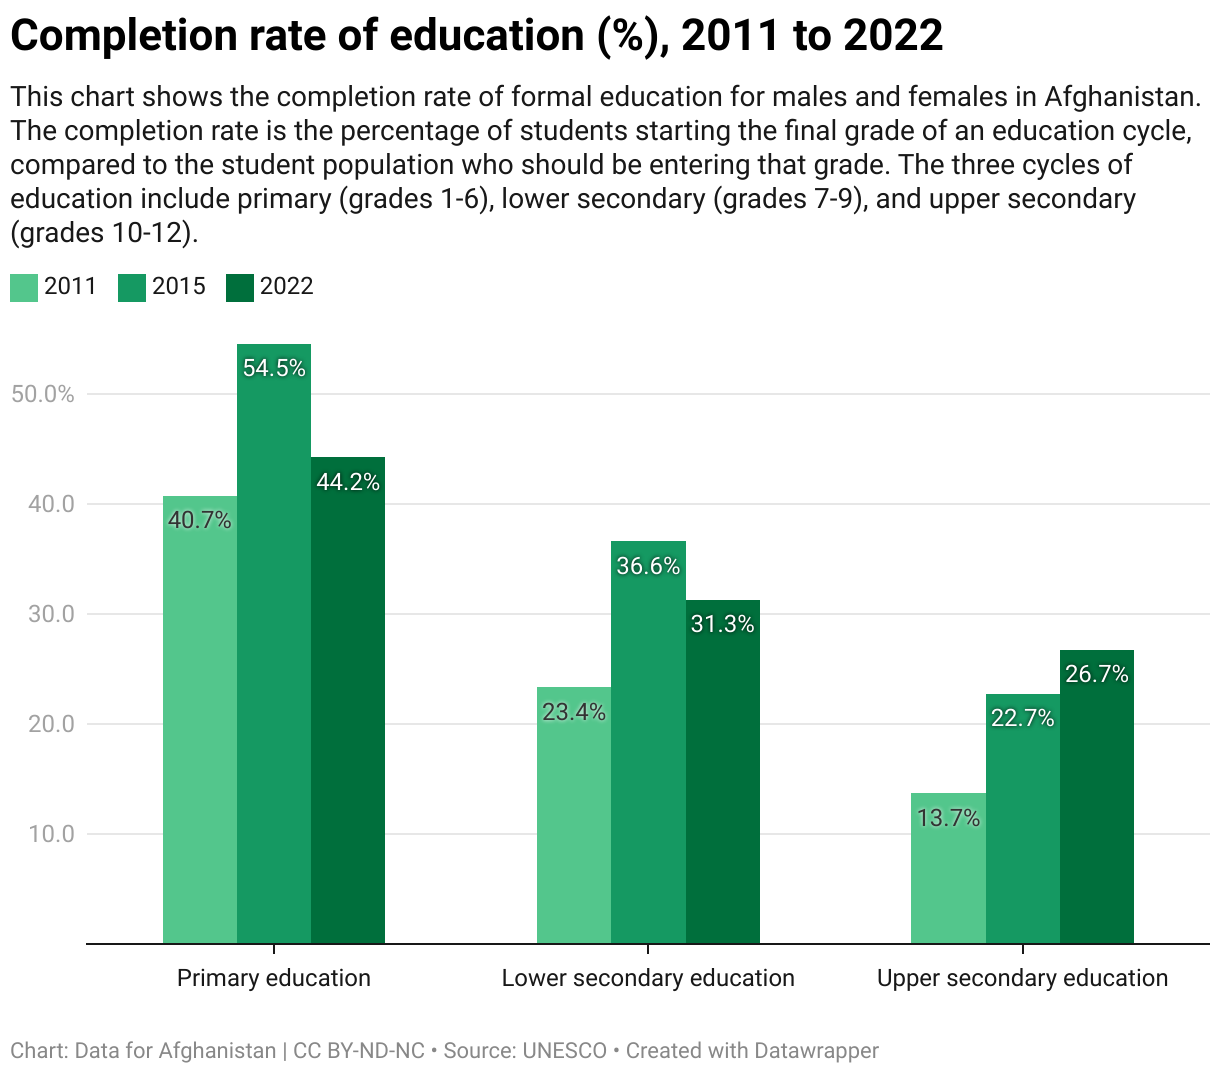
- From 2011 to 2022, the upper secondary education completion rate nearly doubled, rising from 13.7% to 26.7%. This signifies an improvement in keeping more high school students through the 12th grade.
- The primary education completion rate peaked in 2015 at 54.5%, but it dropped to 44.2% by 2022. This decline highlights potential challenges in maintaining primary school completion rates. It is possible that young kids might not have the opportunity to complete through grade 6.
Cite this work:
Data for Afghanistan. (2024). Completion rate of education (%), 2011 to 2022 [Data visualization]. https://dataforafghanistan.org/posts/education/#1-completion-rate. Data retrieved from UNESCO. Licensed under CC BY-ND-NC 4.0.
2. Education attainment rate
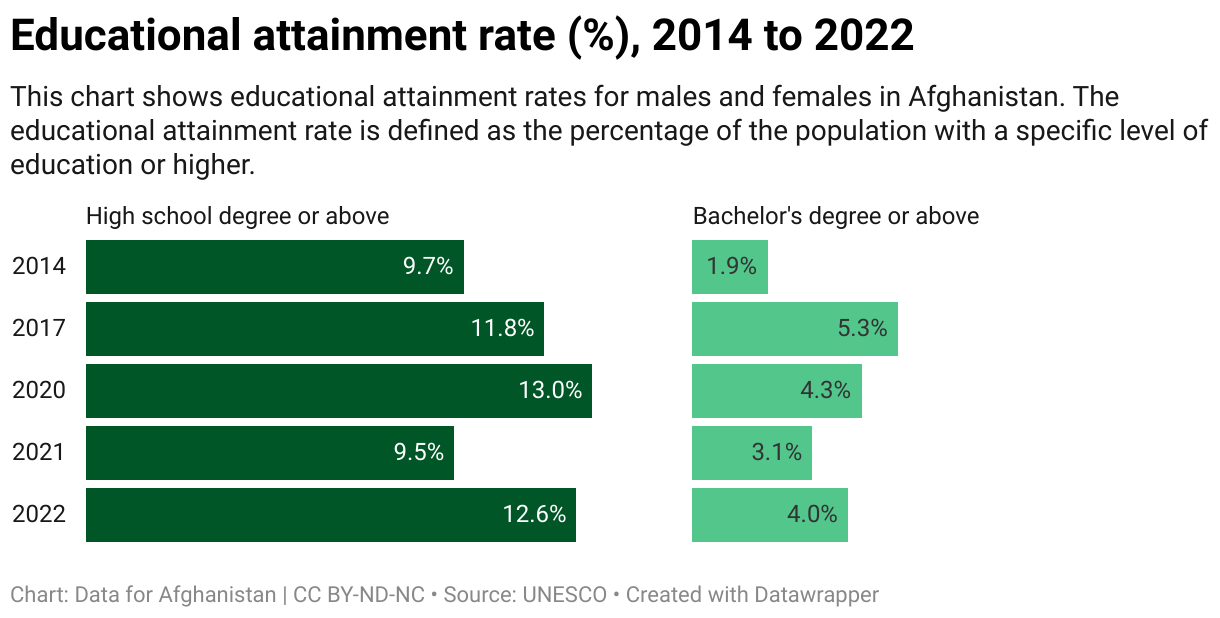
- The educational attainment rate for high school degrees or above peaked at 13% in 2020 but saw a significant dip in 2021 (9.5%) before recovering to 12.6% in 2022. It might be that political instability in 2021 was related to a decrease in the educational attainment rate.
- The percentage of people with a bachelor's degree or higher more than doubled from 1.9% in 2014 to 4% in 2022, showing a growing number of Afghans achieving higher education in recent years. The dip of 1.2% in 2021 was probably related to political instability that year.
Cite this work:
Data for Afghanistan. (2024). Educational attainment rate (%), 2014 to 2022 [Data visualization]. https://dataforafghanistan.org/posts/education/#2-education-attainment-rate. Data retrieved from UNESCO. Licensed under CC BY-ND-NC 4.0.
3. Out-of-school rate
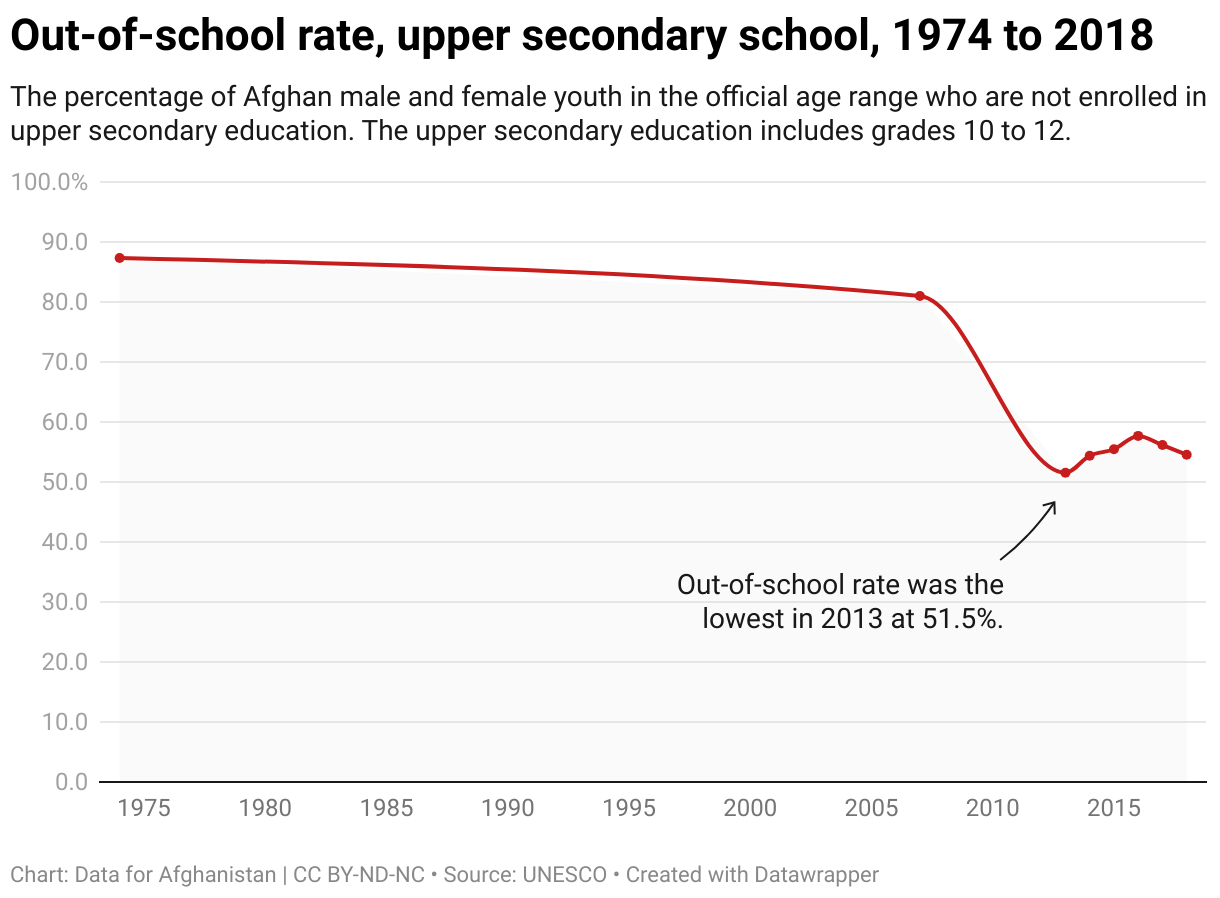
- The out-of-school rate for upper secondary students decreased significantly from 87.3% in 1974 to 51.5% by 2013, indicating an improvement in school attendance in the post-2000 era, highlighted by international aid and economic development in Afghanistan.
Cite this work:
Data for Afghanistan. (2024). Out-of-school rate, upper secondary school, 1974 to 2018 [Data visualization]. https://dataforafghanistan.org/posts/education/#3-out-of-school-rate. Data retrieved from UNESCO. Licensed under CC BY-ND-NC 4.0.
4. Literacy rate
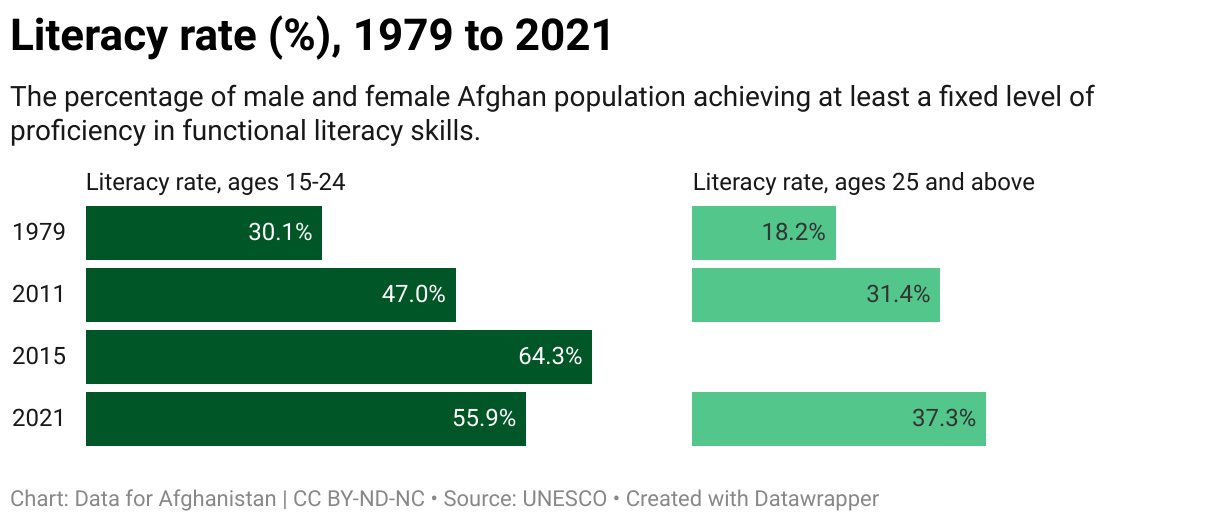
- The literacy rate for young people (ages 15 to 25) saw a rise from 30.1% in 1979 to a peak of 64.3% in 2015, reflecting access to education for younger generations. However, it dropped to 55.9% by 2021, indicating setbacks due to political and economic instability.
- The literacy rate for adults aged 25 and above increased from 18.2% in 1979 to 37.3% in 2021. Despite this progress, a significant portion of Afghanistan's older population remains illiterate, highlighting the need for education opportunities for adults.
Cite this work:
Data for Afghanistan. (2024). Literacy rate (%), 1979 to 2021 [Data visualization]. https://dataforafghanistan.org/posts/education/#4-literacy-rate. Data retrieved from UNESCO. Licensed under CC BY-ND-NC 4.0.
5. Government spending
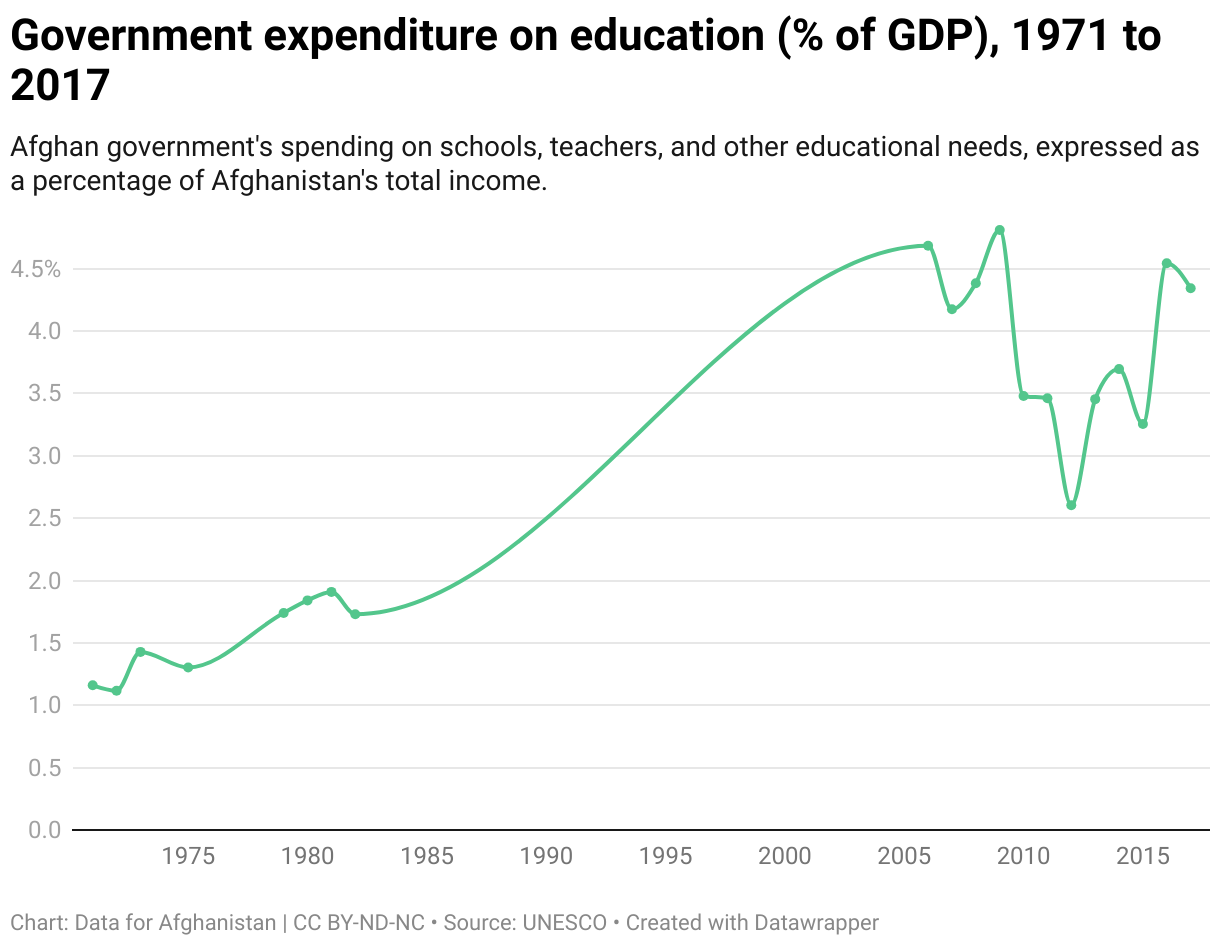
- Government spending on education saw a major jump in 2006, reaching 4.68% of GDP, compared to less than 2% during the 1970s and 1980s. Investment in education increased with Afghanistan's reconstruction efforts.
- After peaking at 4.81% in 2009, education spending as a share of GDP dropped to 3.26% in 2015 before increasing to 4.5% in 2016. These changes highlight inconsistent government spending in education which could undermine access to education in Afghanistan.
Cite this work:
Data for Afghanistan. (2024). Government expenditure on education (% of GDP), 1971 to 2017 [Data visualization]. https://dataforafghanistan.org/posts/education/#5-government-spending. Data retrieved from UNESCO. Licensed under CC BY-ND-NC 4.0.
6. Students per school & teacher
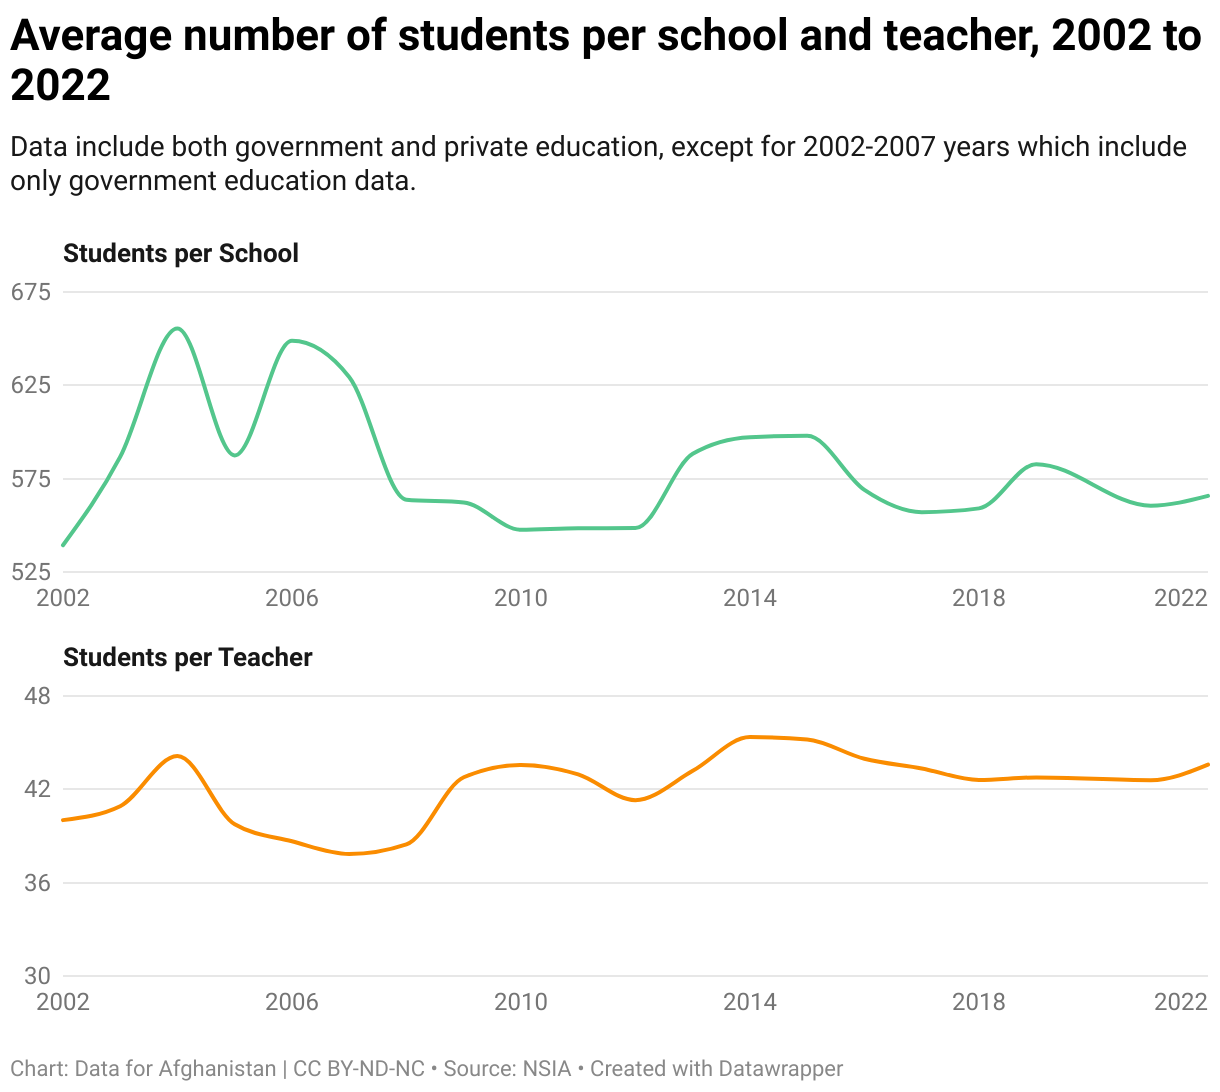
- The number of students per school in Afghanistan has varied over the years. In 2004 and 2006, the number of students per school was the highest in the data (655 and 649, respectively). However, this number has been below 600 since 2008, signaling efforts to distribute students more evenly across educational facilities.
- The number of students per teacher in Afghanistan shows a slightly upward trend from 2002 to 2022. The period from 2010 to 2016 saw consistently high student numbers per teacher, reflecting the growing demand for education, exceeding the pace of new teacher recruitment. After 2015, there was a slight decline in the student-teacher ratio. The overall trend suggests that Afghanistan's education system has struggled to keep up with the growing student population, leading to larger class sizes.
Cite this work:
Data for Afghanistan. (2024). Average number of students per school and teacher, 2002 to 2022 [Data visualization]. https://dataforafghanistan.org/posts/education/#6-students-per-school--teacher. Data retrieved from the National Statistics and Information Authority of Afghanistan. Licensed under CC BY-ND-NC 4.0.
7. Schools
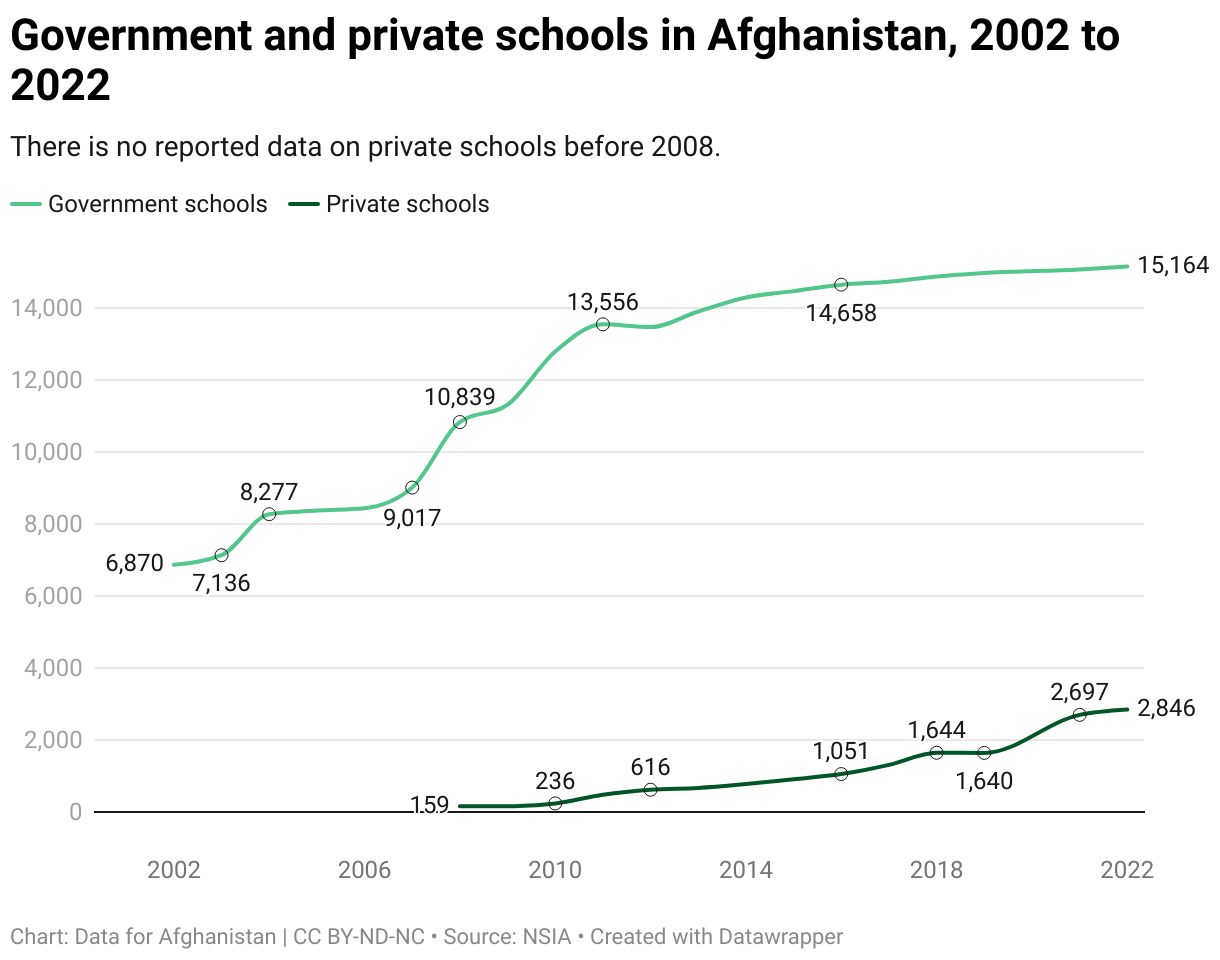
- From 2002 to 2022, the number of government schools grew substantially from 6,870 to 15,164, highlighting investments in public education infrastructure. Rapid growth in government schools took place between 2007 and 2011, i.e., increasing from 9,017 to 13,556. However, the growth has been gradual since 2011.
- Private schools in Afghanistan experienced significant growth, increasing from 159 in 2009 to 2,846 by 2022, reflecting the expanding role of private education. The private education sector experienced its sharpest growth from 2010 to 2012, followed by a noticeable growth in 2021 relative to 2019. While government schools' growth tapered off from 2011 to 2022, private schools' growth intensified.
Cite this work:
Data for Afghanistan. (2024). Government and private schools in Afghanistan, 2002 to 2022 [Data visualization]. https://dataforafghanistan.org/posts/education/#7-schools. Data retrieved from the National Statistics and Information Authority of Afghanistan. Licensed under CC BY-ND-NC 4.0.
8. Students
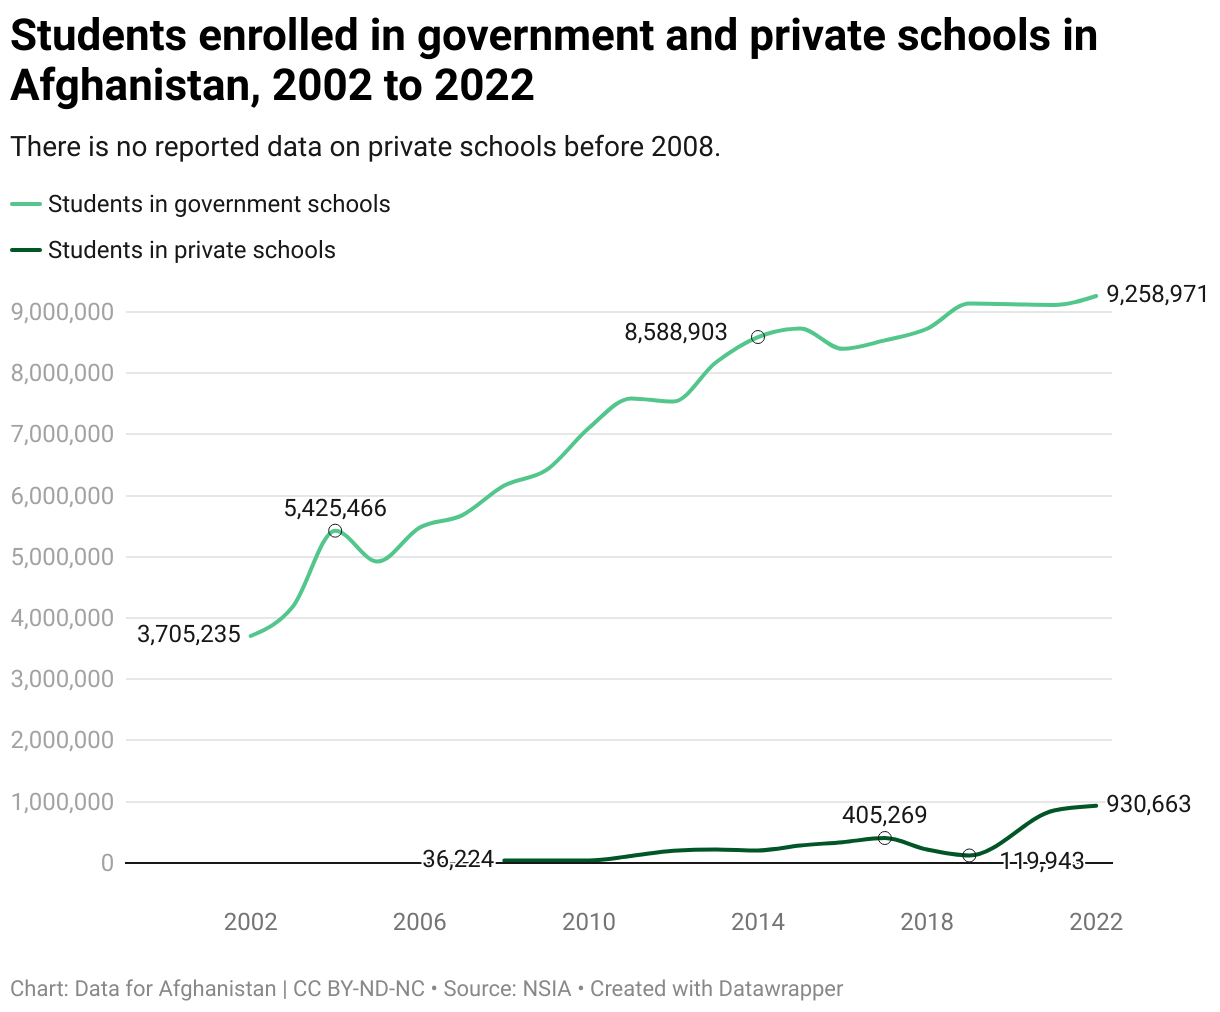
- Student enrollment in Afghan government schools experienced a significant growth from 3.7 million students in 2002 to about 9.3 million in 2022. Student enrollment growth was the highest in the early years. For example, government schools witnessed the highest annual growth of 29.6% in 2004.
- Private school enrollment in Afghanistan started at 36,224 students in 2008 and skyrocketed to 930,663 by 2022 - a 26-fold increase. From 2019 to 2022, private school enrollment in Afghanistan experienced a significant increase of about 677%, rising from 119,943 students in 2019 to 930,663 students in 2022. In contrast, government school enrollment increased by only 1.3% during the same period, growing from 9.14 million to 9.26 million students. The growing shift toward private education could be explained by families seeking private schooling due to education quality perceptions and education limitations in a challenging political context.
Cite this work:
Data for Afghanistan. (2024). Students enrolled in government and private schools in Afghanistan, 2002 to 2022 [Data visualization]. https://dataforafghanistan.org/posts/education/#8-students. Data retrieved from the National Statistics and Information Authority of Afghanistan. Licensed under CC BY-ND-NC 4.0.
9. Teachers
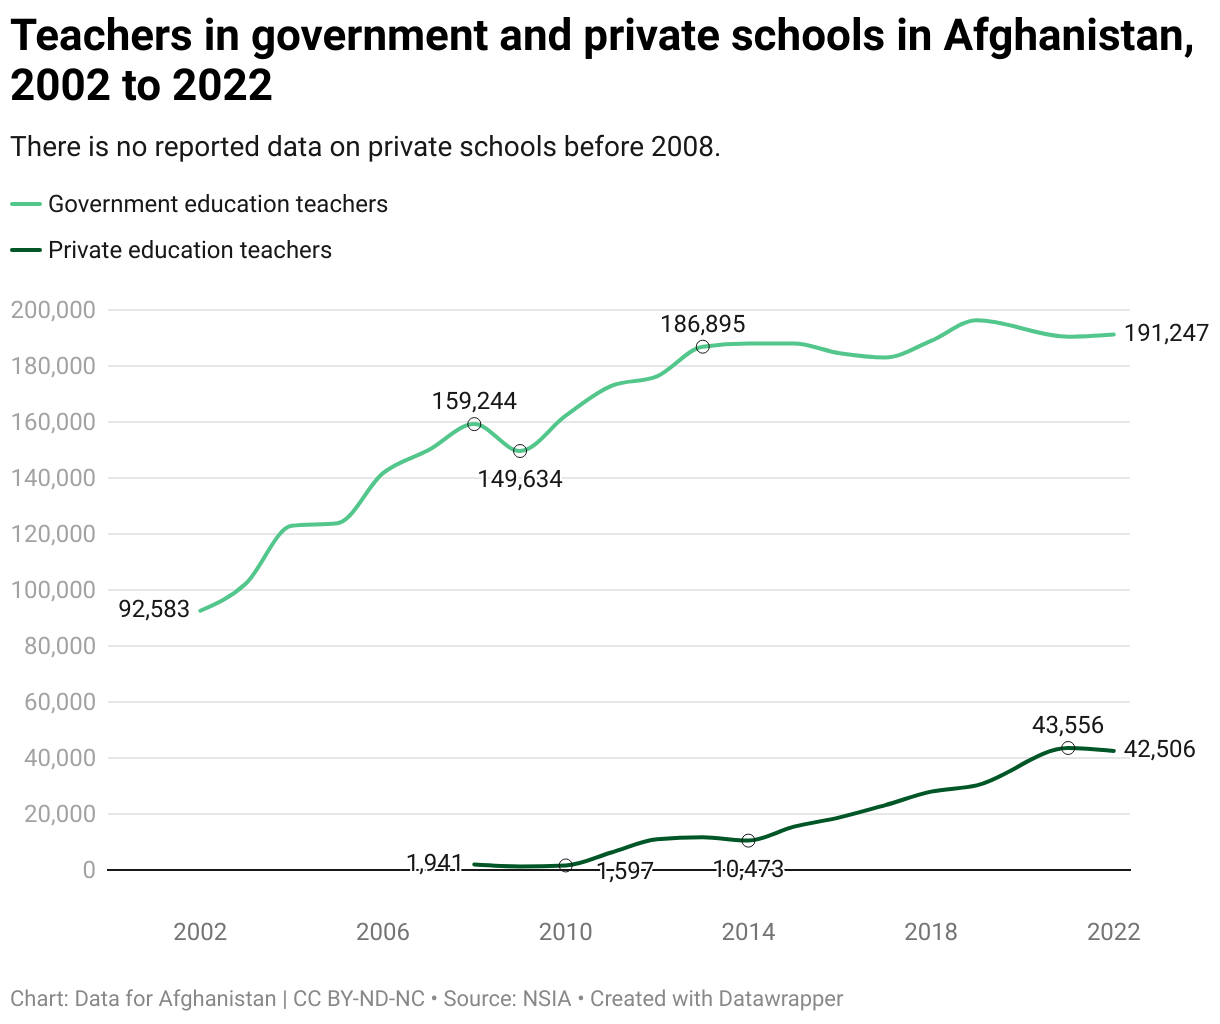
- The number of teachers in Afghan government schools grew significantly from 92,583 in 2002 to 191,247 in 2022. The period between 2002 and 2012 saw consistent increases, with a peak in growth in 2010 when government school teachers reached 162,273—a 75% increase from 2002 levels. The continued teacher increase until 2019 reflects the government's efforts to strengthen public education over two decades.
- Private education also saw a remarkable rise in teacher numbers, from just 1,941 teachers in 2009 to 42,506 by 2022, a staggering 22-fold increase. The consistent growth is particularly notable from 2014 to 2022, when the number of private school teachers quadrupled, highlighting a growing demand for private education as families may increasingly view it as a quality alternative to government schools. From 2021 to 2022, private school teachers decreased by about 1,000, which could be due to the challenging economic and political circumstances at the time.
Cite this work:
Data for Afghanistan. (2024). Teachers in government and private schools in Afghanistan, 2002 to 2022 [Data visualization]. https://dataforafghanistan.org/posts/education/#9-teachers. Data retrieved from the National Statistics and Information Authority of Afghanistan. Licensed under CC BY-ND-NC 4.0.
10. Islamic Students
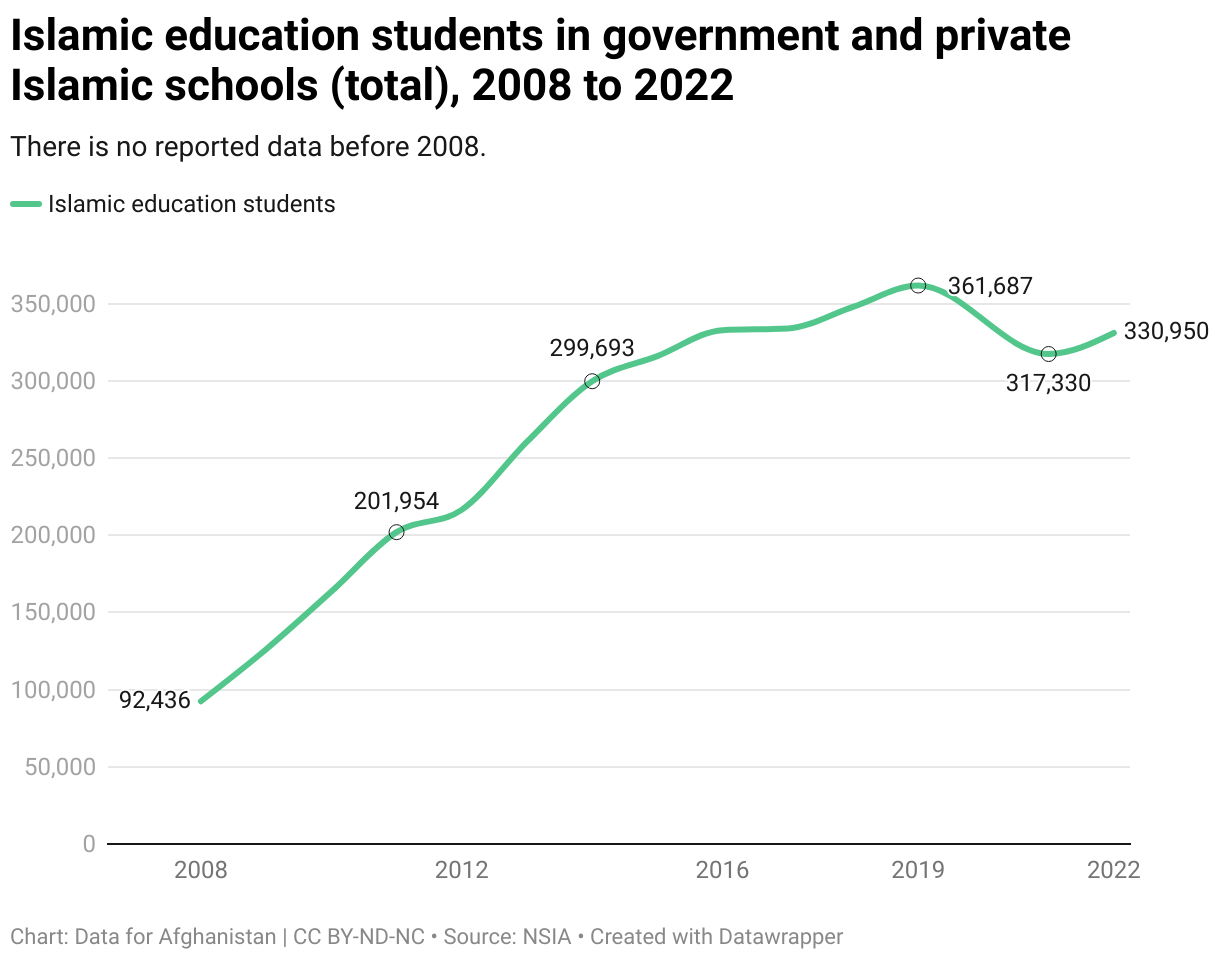
- Islamic school enrollment in Afghanistan increased from 92,436 students in 2008 to a peak of 361,687 students in 2019. This growth represents a significant rise in demand for Islamic education over the decade. However, enrollment has since declined, reaching 330,950 students by 2022.
Cite this work:
Data for Afghanistan. (2024). Islamic education students in government and private Islamic schools (total), 2008 to 2022 [Data visualization]. https://dataforafghanistan.org/posts/education/#10-islamic-students. Data retrieved from the National Statistics and Information Authority of Afghanistan. Licensed under CC BY-ND-NC 4.0.